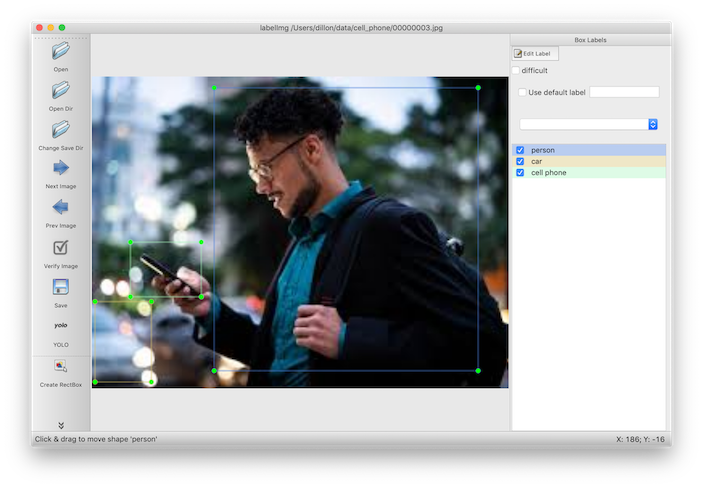
There are a couple of really nice image annotation libraries that are free and open source. For example, I use LabelImg whenever I need to hand-annotate bounding boxes to create new (or augment existing) datasets for object detection. It can output labels in both Pascal and YOLO formats, which is an added bonus.
However, sometimes you need to generate image annotations that aren't in a standard format. In particular, I needed to generate mappings from a predefined grid of reference image locations to a warped version of that same image. The warping was highly nonlinear, so standard image registration workflows -- like using Harris corners for keypoints, generating BRIEF descriptors for eack keypoint, matching by desciprots, then using RANSAC to fit an affine transform -- would routinely fail to match more than half of the keypoints. To make matters worse, the keypoints that were missing pairs were all in the most heavily warped parts of the image, which is where we needed to mappings the most!
Since the image set was small, it made sense to do this the old fashioned way.
But those sophisticated annotation tools didn't have an option to output a simple list of (x, y) image locations. What we needed was a GUI framework that would let us:
- display an image
- store the (x, y) location of clicks on the image
- re-draw the clicked locations on top of the image
- return the list of points as a standard Python datastructure
- have a working solution in less than an hour
We turned to Chaco, which is a plotting library that has built-in support for listening to events. The specification for the Chaco plot itself is pretty simple, and should look familiar if you've used an interactive plotting library before. The main difference is that we're putting the plot inside of our own custom class instead of handling the plot object interactively, so the class can have methods that act on the plot.
from chaco.api import ArrayPlotData, Plot, bone
from traits.api import HasTraits, Instance, List, Array

class ImagePlot(HasTraits):
    x_values = List()
    y_values = List()
    image = Array()
    plot = Instance(Plot)

    def _plot_default(self):
        plotdata = ArrayPlotData(imagedata=self.image, x=self.x_values, y=self.y_values)
        plot = Plot(plotdata)
        plot.img_plot("imagedata", colormap=bone, origin="top left")
        plot.plot(('x', 'y'), type='scatter', color='red')
Chaco has built-in tools for standard interactions like panning and zooming, but not for recording and storing click locations, so this required a custom plotting tool. To translate from the pixel-space on the screen to the data-space on the image, we use the map_data method defined on plot objects.
from enable.api import BaseTool

class CustomTool(BaseTool):

    container = Instance(ImagePlot)

    def normal_left_down(self, event):
        x, y = self.container.plot.map_data((event.x, event.y))
        self.container.x_values.append(x)
        self.container.y_values.append(y)
To ensure that we can see the annotations we've created in real time, we add a method to our plot class that gets registered as an event handler anytime the list of (x, y) coordinates changes.
from traits.api import on_trait_change

@on_trait_change('x_values,y_values')
def new_point_added(self):
    self.plot.data.set_data('x', self.x_values[:len(self.y_values)])
    self.plot.data.set_data('y', self.y_values[:len(self.x_values)])
    self.plot.request_redraw()
Finally, we want to specify some things about the user interface, like its shape and the layout of the elements inside it. traitsui provides a declarative syntax for this.
from traitsui.api import Item, View, VGroup, HGroup

traits_view = View(
    HGroup(
        VGroup(
            Item("plot", editor=ComponentEditor(), show_label=True),
        ),
        VGroup(
            Item("x_values"),
            Item("y_values")
        ),
    ),
    width=1200,
    height=600,
    resizable=True,
    title="Chaco Plot",
)
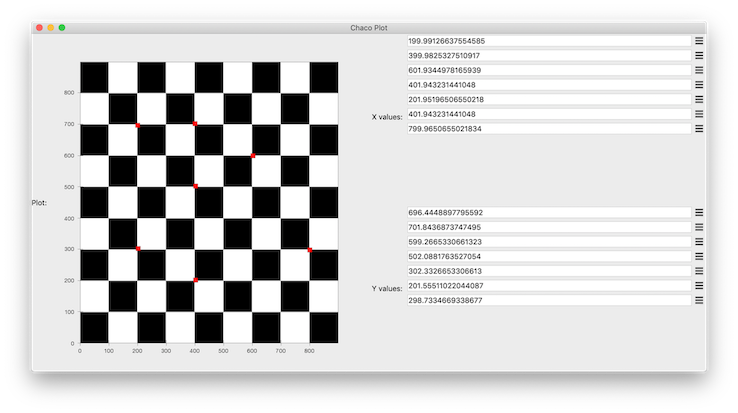
And that's it! In about 50 lines of code we have a GUI that we can pop up on demand, and returns our list of x and y coordinates as a list of tuples.
def get_coords_from_gui(image):
    plot = ImagePlot(image=image)
    plot.configure_traits()
    return list(zip(plot.x_values, plot.y_values))
Here's what it looks like IRL:
And here is the full code listing to run it yourself:
from chaco.api import ArrayPlotData, OverlayPlotContainer, Plot, bone
from enable.api import BaseTool, ComponentEditor
from traits.api import HasTraits, Instance, List, Array, on_trait_change
from traitsui.api import Item, View, VGroup, HGroup

class ImagePlot(HasTraits):
    x_values = List()
    y_values = List()
    image = Array()
    plot = Instance(Plot)

    def _plot_default(self):
        plotdata = ArrayPlotData(imagedata=self.image, x=self.x_values, y=self.y_values)
        plot = Plot(plotdata)
        plot.img_plot("imagedata", colormap=bone, origin="top left")
        plot.plot(('x', 'y'), type='scatter', color='red')
        plot.tools.append(CustomTool(plot, container=self))
        return plot

    @on_trait_change('x_values,y_values')
    def new_point_added(self):
        self.plot.data.set_data('x', self.x_values[:len(self.y_values)])
        self.plot.data.set_data('y', self.y_values[:len(self.x_values)])
        self.plot.request_redraw()

    traits_view = View(
        HGroup(
            VGroup(
                Item("plot", editor=ComponentEditor(), show_label=True),
            ),
            VGroup(
                Item("x_values"),
                Item("y_values")
            ),
        ),
        width=1200,
        height=600,
        resizable=True,
        title="Chaco Plot",
    )

class CustomTool(BaseTool):

    container = Instance(ImagePlot)

    def normal_left_down(self, event):
        x, y = self.container.plot.map_data((event.x, event.y))
        self.container.x_values.append(x)
        self.container.y_values.append(y)