Recently, we released functionality in niacin for performing data augmentation on timeseries. As a part of this, we wanted to be able to show before and afters in the documentation for how a timeseries (in this case, a sine curve) gets transformed by any particular augmenting function. In a lot of user guides (e.g. in pandas), this is done by embedding plotting code in the documentation source files which gets executed when the documentation is compiled. Other libraries (e.g. scikit-learn) will have directories of examples, where you can look at individual notebooks showing longer demonstrations of how to use a particular tool or visualize a particular result.
These are both excellent approaches, but we wanted something a little bit closer to the user. In particular, we wanted this information to be available whenever someone used the built-in Python help function, or the IPython ? magic.
In Python, the output of these is populated by the __doc__ attribute on an object, which, by default, will use a string object that is created immediately below the function declaration. For example, if you do something like:
def cool_function():
    """this does cool stuff"""
    pass
the __doc__ attribute will have "this does cool stuff", and this shows up under the help as:
Help on function cool_function in module __main__:

cool_function()
    this does cool stuff
Then, if we want a plot there, we'll also want a way to turn that plot into text.
There are a few tools that can do this -- in particular, most of the page 1 results on Google search refer to gnuplot or Python wrappers around gnuplot (e.g. termplotlib).
Somewhere past the first page, is this blog post from maybe some time in 2007 about a lightweight, dependency-free, ascii plotting library with syntax that is somewhat like matplotlib. Because the license is open (3-clause BSD), this means we are free to do whatever we want with it, provided we include the original license, and do not imply that the original author is endorsing anything we are doing.
This is a good thing, since the library was written for Python 2.
Porting the code to Python 3 was simple (basically just changing the print statements and xrange calls), and voilà, we have our nice in-docstring plots:
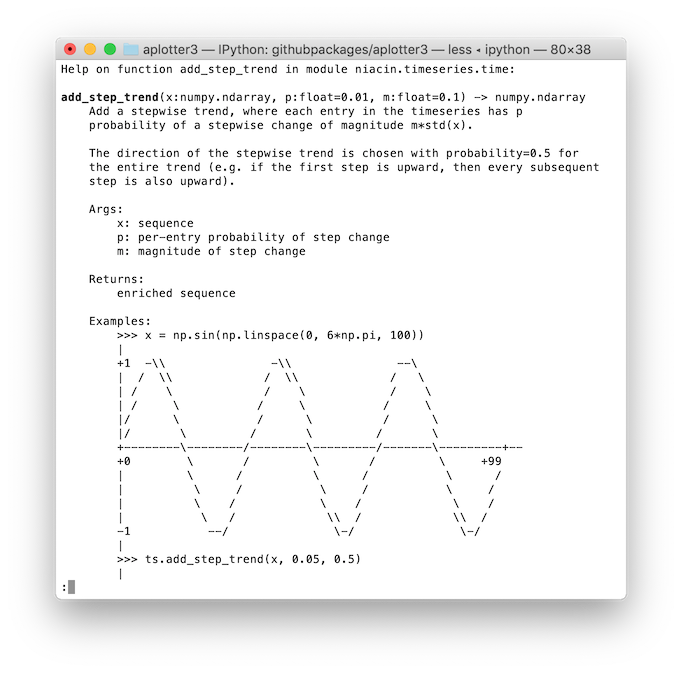
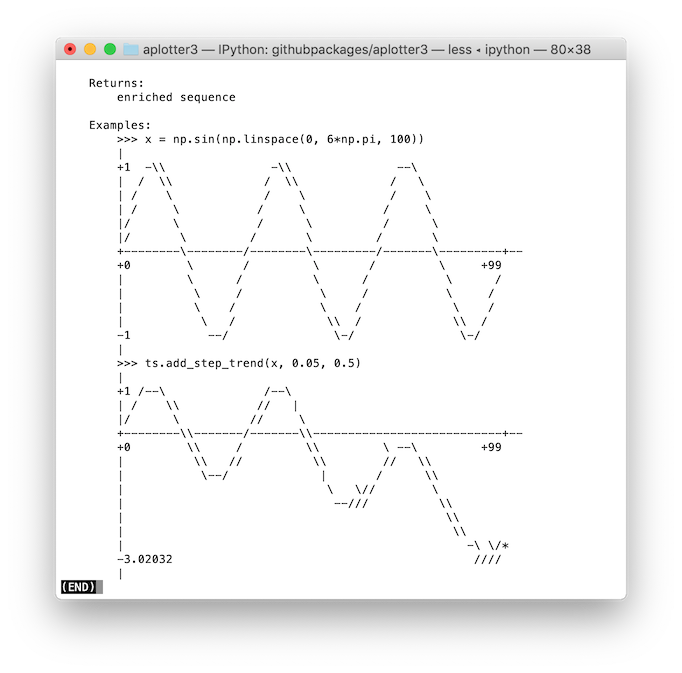
If you want to check it out for yourself, the Python 3 version is on GitHub under the name aplotter3. Gratitude to Imri, a stranger on the internet, for creating this tool and for licensing it permissively.